
- Home
- Fish Size Distribution Chart for Optimizing Sorting and Grading Systems
Fish Size Distribution Chart Solutions

Why Size Distribution Matters in Fish Processing
In seafood production, understanding how products are distributed by size and weight is essential for improving sorting accuracy and overall efficiency. A fish size distribution chart provides a clear overview of how products are grouped, helping operators make better decisions about grading parameters.
Without proper data, sorting systems may operate inefficiently, leading to inconsistent product categories and reduced output quality. Distribution analysis helps eliminate these issues.


Improving Sorting Accuracy with Data
A fish size distribution chart for optimizing sorting and grading systems allows producers to define more accurate grading ranges based on real production data. By analyzing how products are distributed, operators can adjust system thresholds to create more balanced and precise classification.
This improves sorting accuracy and reduces the number of products that fall outside expected ranges. As a result, product uniformity increases and overall quality becomes more consistent.
Supporting Efficient Production Planning
Understanding size distribution helps optimize production flow and planning. A fish size distribution chart makes it easier to balance output across different grading categories, preventing bottlenecks and improving throughput.
It also supports better coordination between sorting, packaging, and shipment processes, ensuring smoother operations across the entire production line.
Enhancing System Performance
When sorting systems are aligned with actual product distribution, performance improves significantly. A fish size distribution chart for optimizing sorting and grading systems helps fine-tune machine settings, reducing errors and improving operational stability.
This leads to smoother processing, consistent classification, and better overall efficiency.
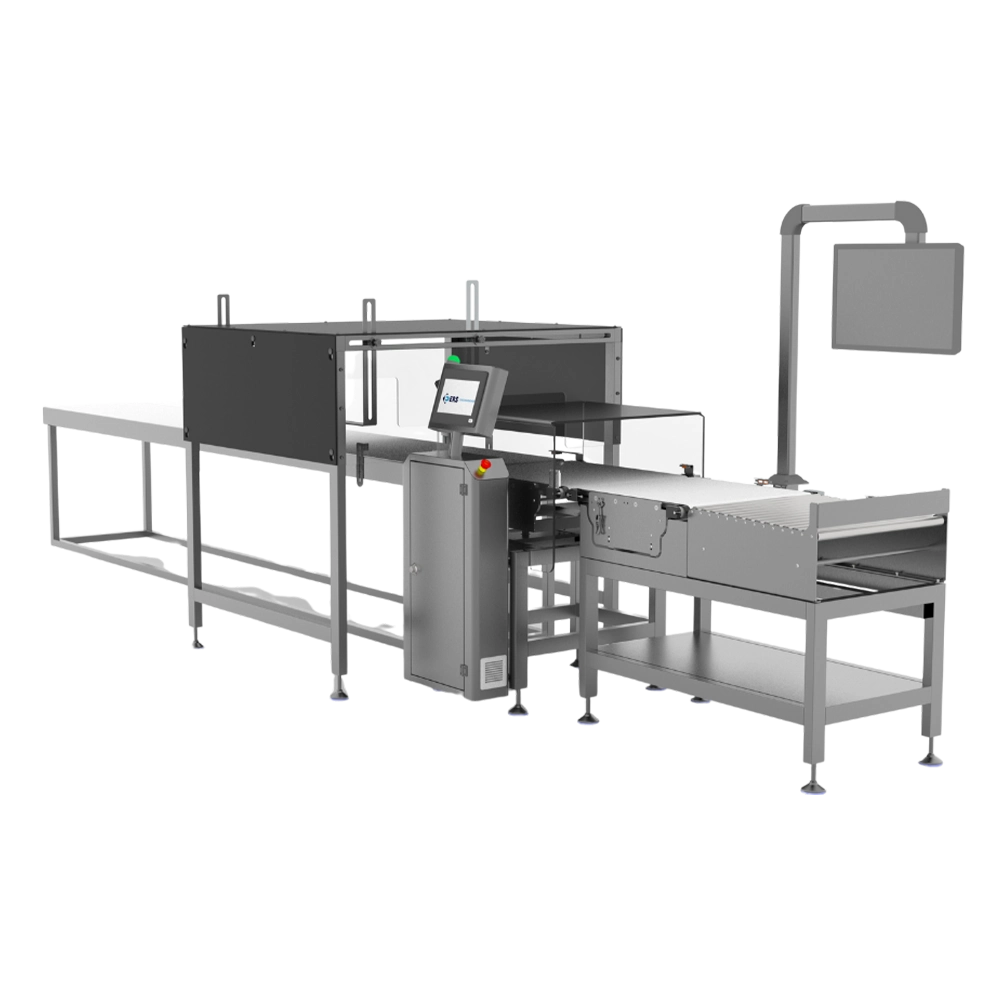
Cost Efficiency
Reduces product giveaway by maintaining weights close to target values across high-volume production lines.
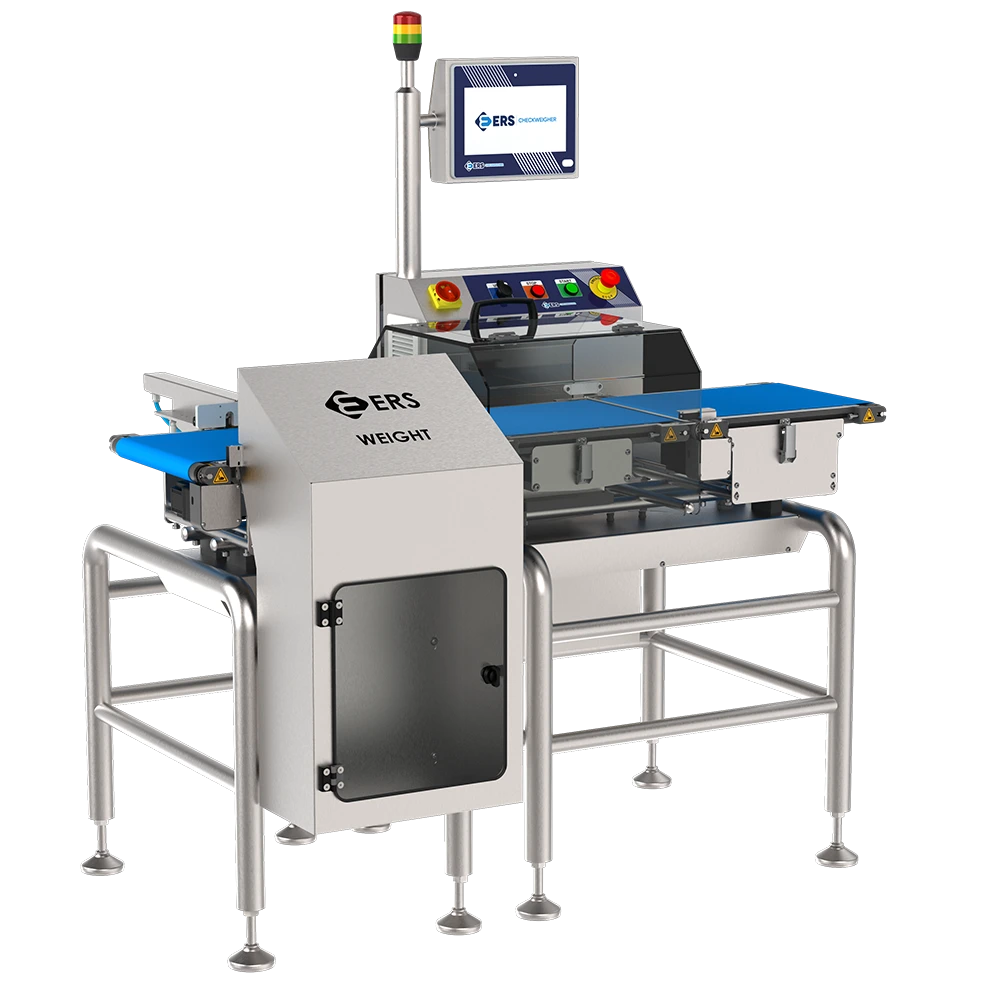
Continuous Operation
Supports uninterrupted production flow with smooth rotary movement for stable and consistent weighing performance.
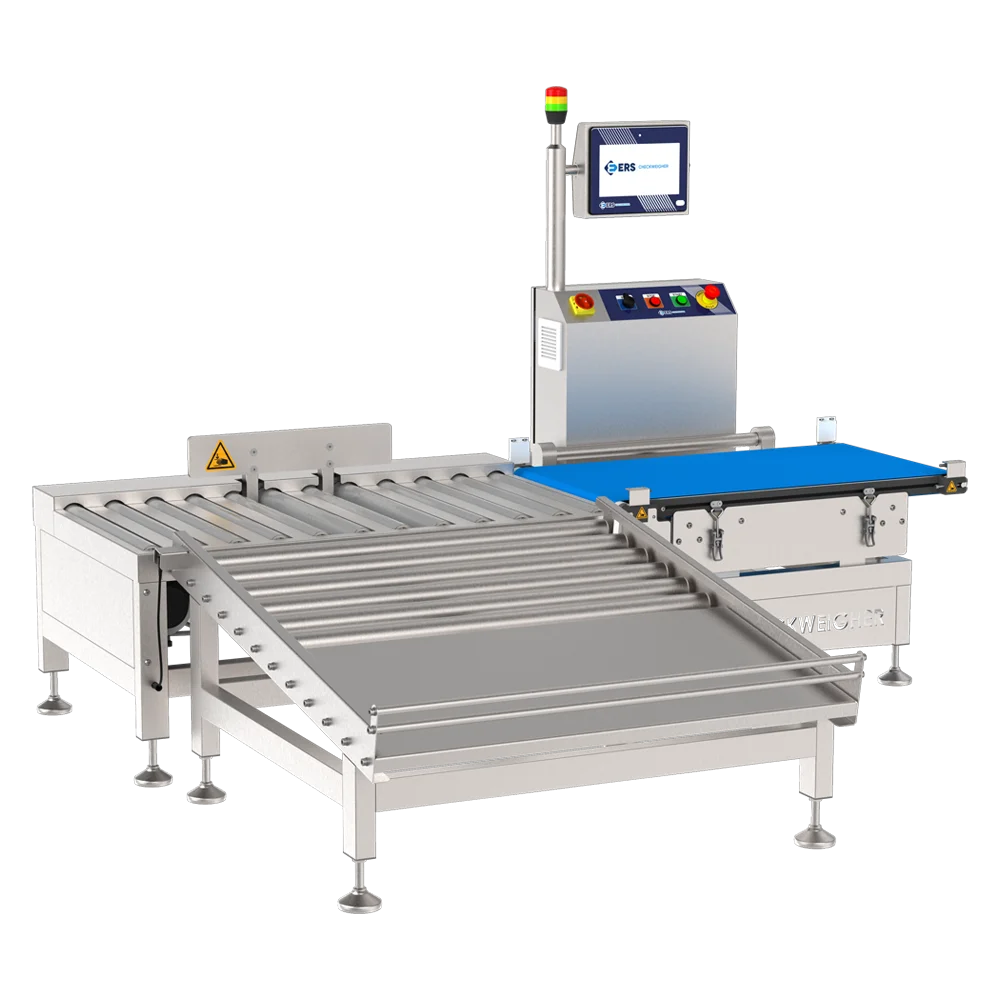
Precision Weighing
Ensures accurate and repeatable measurement with a rotary system designed for high-precision industrial weight control.
System Integration
Integrates seamlessly with conveyors and automated equipment for improved process control and production efficiency.
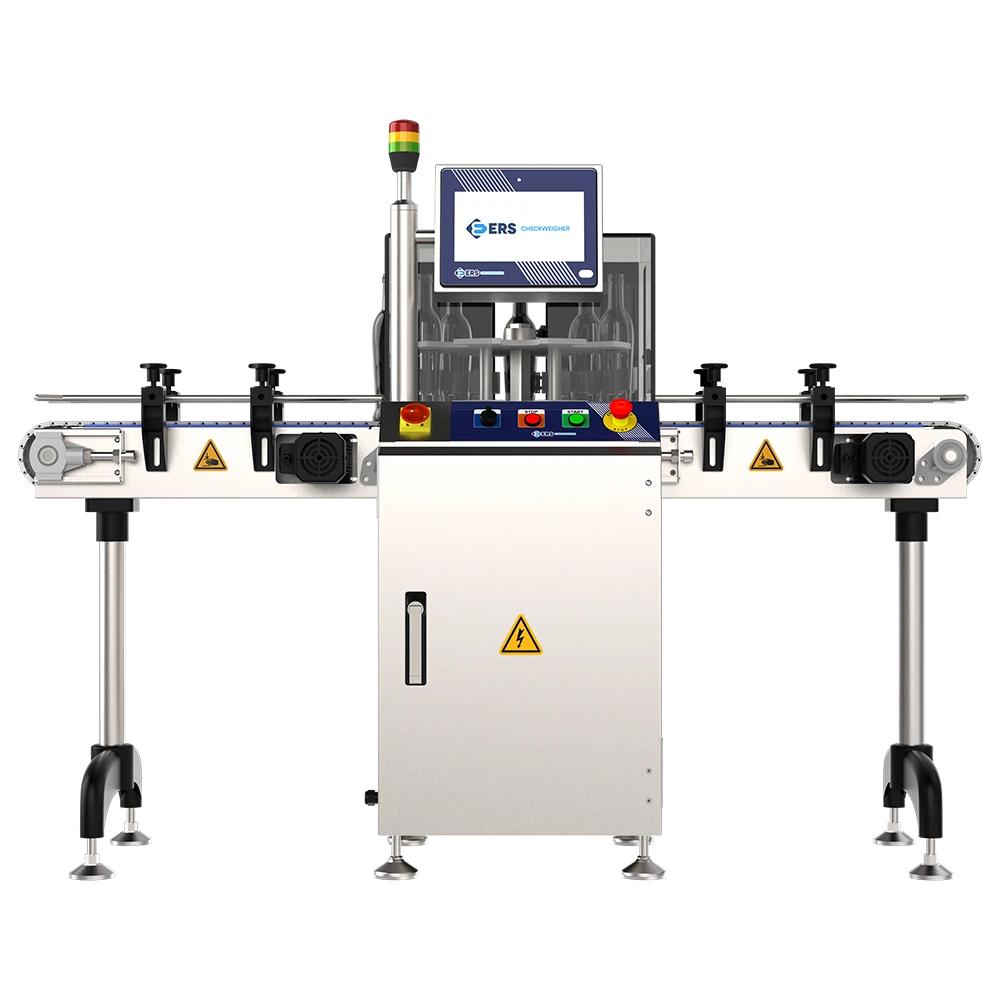
Applications of Food Checkweighers
Data-Driven Decision Making
Modern seafood processing relies on accurate and timely data to maintain efficiency and consistency. A fish size distribution chart provides valuable insights that allow operators to monitor grading performance and identify variations in product flow across different size categories.
By analyzing both real-time and historical data, businesses can better understand production patterns and adjust sorting parameters when needed. This approach helps reduce inconsistencies and ensures that grading systems remain aligned with actual product distribution.
Using data as a decision-making tool also supports continuous improvement. It allows operators to react quickly to changes in incoming product size, helping maintain stable output quality and overall process efficiency.
A Smart Tool for Better Grading
As production demands increase, the need for accurate and efficient sorting becomes more important. A fish size distribution chart for optimizing sorting and grading systems provides a practical way to improve classification and maintain better control over the grading process.
By offering a clear overview of how products are distributed, the chart helps define more precise grading ranges and reduces classification errors. This leads to more consistent product categories and improved overall quality.
In addition, using a structured distribution approach supports smoother production flow and better resource management. For businesses aiming to optimize sorting performance and maintain high standards, a fish size distribution chart becomes an essential tool for long-term efficiency and control.